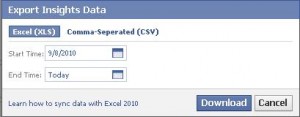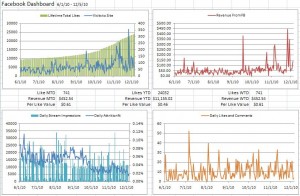
I made this marketing dashboard below using that data from Facebook Insights and a few metrics from Google Analytics. (The numbers are all fictional so don’t read into them too much).
The purpose of this dashboard is to visualize Facebook’s impact on the business’s website in terms of revenue and measure the quality of the content posted on the Facebook page.
The top left graph shows total number of Likes with a line graph over the top of it showing total number of visits to the site from Facebook. Do more Likes equate to more visits to your site? You would need to get visits data from Google Analytics to put this together.
The next chart over shows total amount of revenue from Facebook. Revenue may not be the goal of your site for Facebook, maybe its leads generated or email and RSS subscriptions. Whatever it is, you should try to quantify some kind of outcome as a result of your efforts on Facebook. More Likes of your page should be a means to an end, not the end itself.
The bottom left chart shows daily stream impressions (amount of impressions your status updates have had in your fan’s news feeds) with a line over it showing a percentage of attrition – meaning number of people un-liking you. It’s important to be posting good content that people would want and at the same time not post it so frequently that it burns people out. In my example you can see a correlation between frequency of impressions and the number of un-likes. You can also see that number of un-likes has decreased and looks like it is still decreasing which is a sign that the frequency and quality is getting closer to the sweet spot.
The last chart shows the amount of interaction the fans have with the page in terms of Likes and comments on a daily basis. Again, this is a good way to monitor the quality of your Facebook page’s content.
So there you have it, my take on a marketing dashboard for Facebook. It doesn’t include anything having to do with Facebook ads, I think I’ll tackle that dashboard next. Let me know what you think, and if you’re interested, click this link to download the Facebook Marketing Dashboard in Excel.
